
The idea behind seccomp profiles for a container is simple: your container makes good syscalls, let’s block the bad system calls. So you record the syscalls your container makes, build a seccomp JSON profile that allows only those syscalls, then anything your app didn’t call, gets blocked. Minimal attack surface. Perfect. We did our job?
It turns out, the generation of these profiles is easy, but generating them accurately is hard. Many of you have seen a tool that claims to auto-generate seccomp profiles for you. And they work! But, what does “good” look like for these tools? Are they accurate? Do they generate secure profiles? Are they actually reducing any risk?
Here’s the tools I tested:
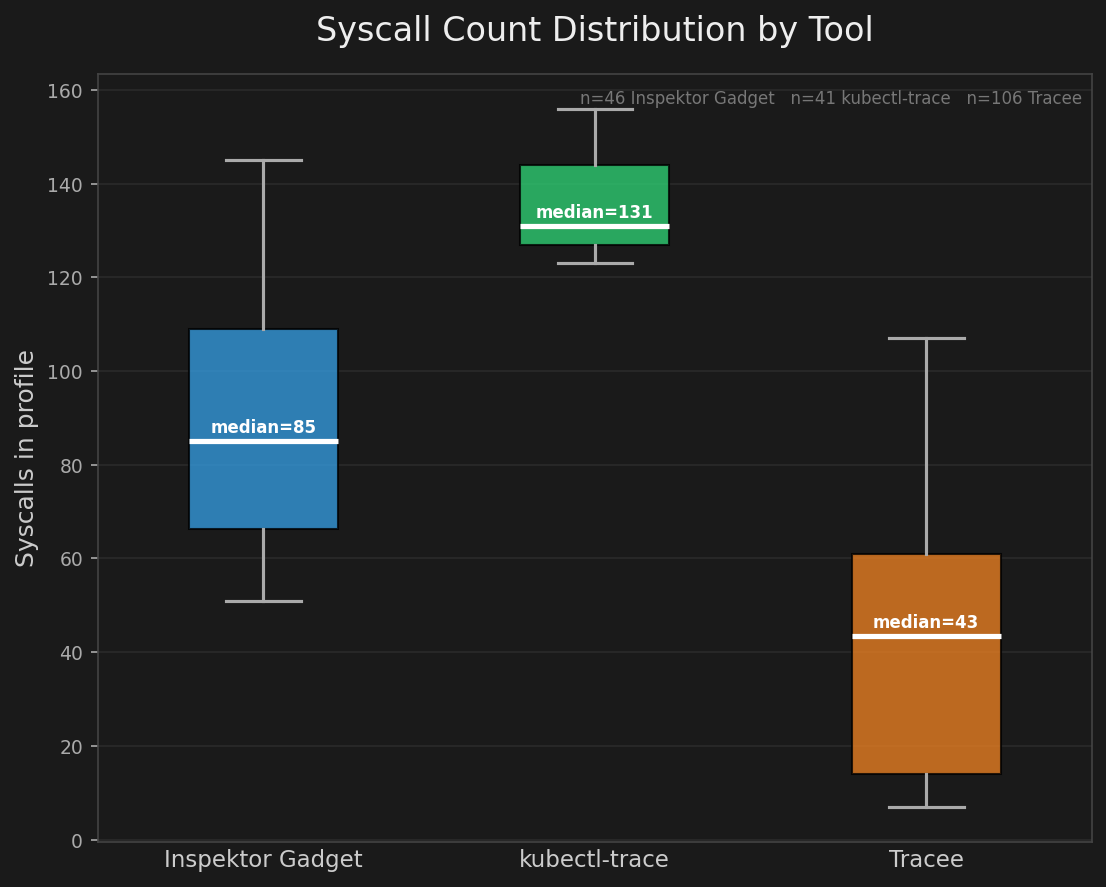
I took each tool, ran them in a Minikube VM, configured a set of Kubernetes Pods to run and then asked each tool to trace the system calls for that given Pod. The results were interesting.
The first baseline was just a hello world app written in C.
#include <stdio.h>

int main() {
    printf("Hello, World!\n");
    return 0;
}
Then I ported this to a simple container.
FROM cgr.dev/chainguard/static:latest
COPY hello /hello
ENTRYPOINT ["/hello"]
Then it to a cluster and traced it with the tools:
kubectl gadget advise seccomp-profile start --podname hello-world --namespace default
kubectl run hello-world --image=hello-world-cg --restart=Never
kubectl gadget advise seccomp-profile stop --podname hello-world --namespace default
cat <<'EOF' | kubectl apply -f -
apiVersion: v1
kind: Pod
metadata:
    name: tracee
spec:
    hostPID: true
    containers:
    - name: tracee
        image: aquasec/tracee:latest
        securityContext:
            privileged: true
        volumeMounts:
        - name: tmp-tracee
            mountPath: /tmp/tracee
        command: ["trace"]
        args: ["--output", "format:json", "--filter", "comm=hello", "--filter", "event=syscalls"]
    volumes:
    - name: tmp-tracee
        hostPath:
            path: /tmp/tracee
EOF
kubectl trace run -e '
tracepoint:raw_syscalls:sys_enter { @[str(args->id)] = count(); }
END { print(@); }
' pod/hello-world-pod
They all successfully created a profile that has a bunch of system calls with a default block and a certain set that are allowed.
// hello-world-cg
{
  "defaultAction": "SCMP_ACT_ERRNO",
  "architectures": [
    "SCMP_ARCH_X86_64",
    "SCMP_ARCH_X86",
    "SCMP_ARCH_X32"
  ],
  "syscalls": [
    {
      "names": [
        "arch_prctl",
        "brk",
        "capget",
        "capset",
        "chdir",
        "close",
        ...
      ],
      "action": "SCMP_ACT_ALLOW"
    }
  ]
}
The first issue is that none of the tools produce the same results. This might be surprising because the code is the same, the container runs the same, and the environment is exactly the same. Check out this example comparing two hello world profiles.
To answer this, I took the Hello World example above and scaled it out to 100+ images. Each image I configure to run “properly” (best effort) to get a good sample of how they’d actually be running in production, and then I traced them all. The results show that there’s a large difference in opinion on which system calls should be allowed.
I believe the disagreement comes from three places:
Tracing layer matters. A tool like strace intercepts at the ptrace layer and so it’s watching the process from the outside. Inspektor Gadget hooks into the kernel via eBPF tracepoints. Other tools will hook at the OCI level so it sits in the container lifecycle between create and start. Each vantage point sees a different slice of reality. strace might capture its own syscalls. eBPF sees kernel-level calls the ptrace layer misses. The OCI hook sees runtime setup that neither of the others do.
Tracing might not start only with your entrypoint. Before your entrypoint ever runs, containerd, the containerd-shim, and runc are doing work. They’re setting up namespaces, mounting filesystems, configuring cgroups, pivoting roots. All of those operations use syscalls. Depending on where the tracer hooks in, some or all of those runtime syscalls end up in your “application” profile. Your hello world container didn’t call clone(). But something in the chain did, and now it’s in your profile.
Same code, different syscalls. There are a bunch of reasons that the exact same code might product different system calls when traced at different times. One is compiler optimizations depending if you’re using glibc vs musl and depending on kernel versions – there are times when a fork() is converted to a clone(). Call stat() and depending on the kernel, you get stat, fstat, or newfstatat. The syscall your code “makes” is not necessarily the syscall the kernel sees.
Two identical containers on two different systems, built slightly differently, produce legitimately different syscall lists. This is one of the challenges around scaling this across all of your clusters in your org.
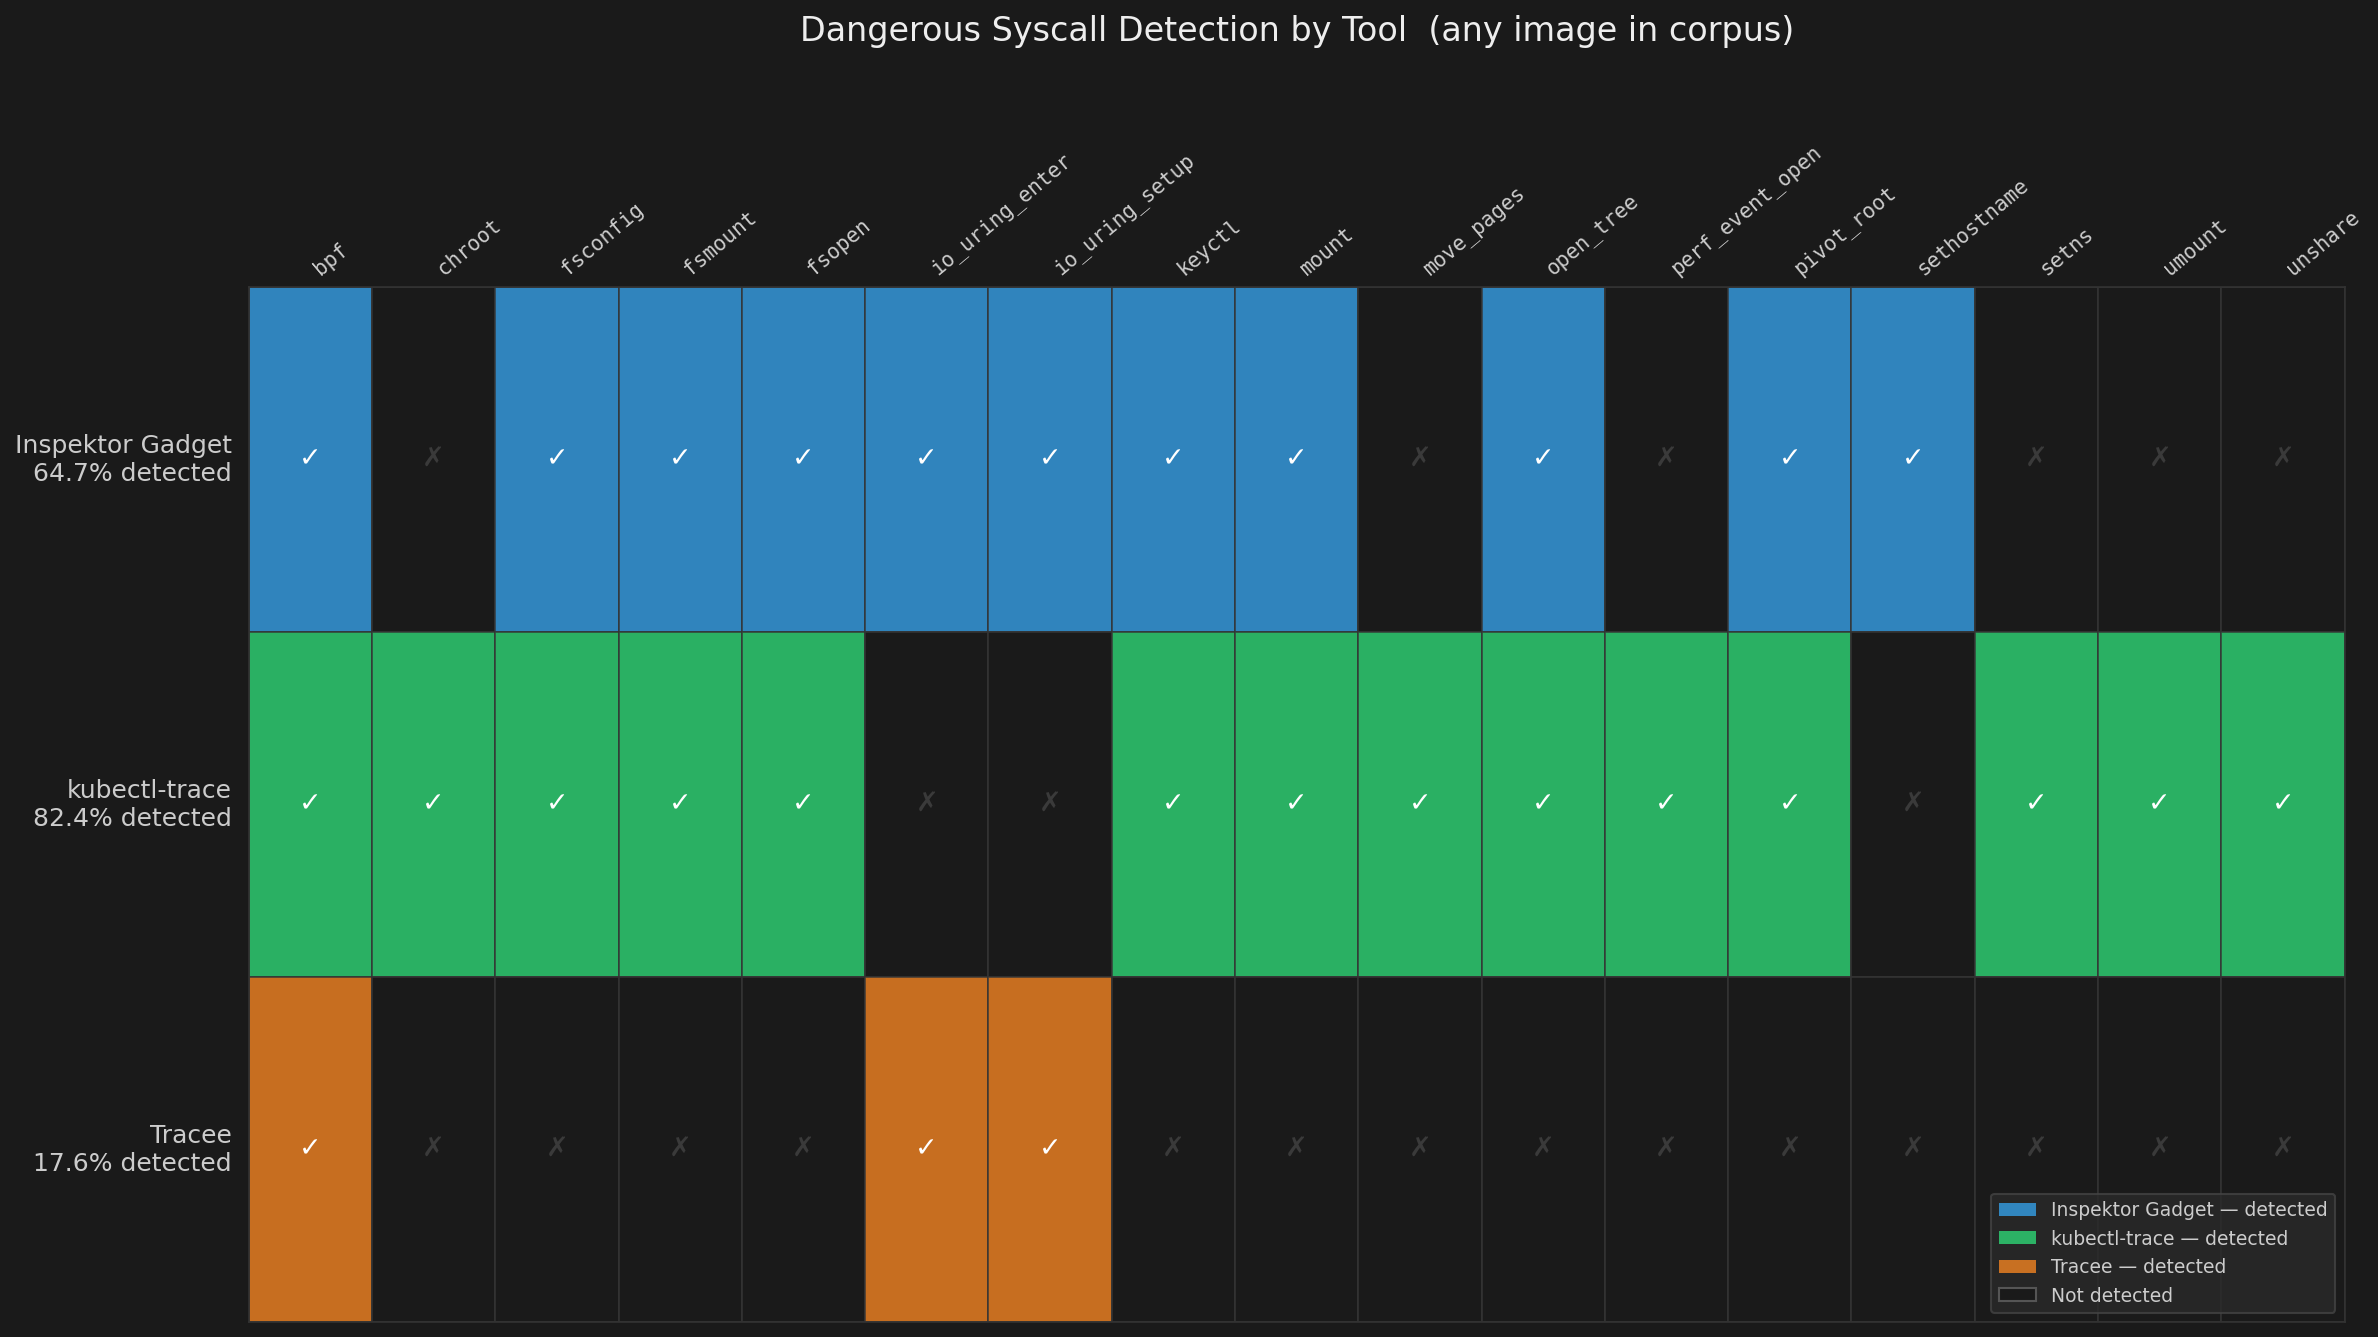
The last problem’s biggest risk is simply that the container won’t start. If you forget to add a system call, it will just crash/kill/error out the container. But a more direct impact on security is that you can generate a profile that looks correct, passes CI, deploys fine, but makes the container less secure. The two examples I’ll call out are bpf() and io_uring() sneaking into auto-generated profiles. If you’re an attacker reading a seccomp profile, these are what you look for first.
What bpf allows: near-arbitrary kernel code execution. You can load eBPF programs that hook into kernel functions, read and write kernel memory, intercept syscalls, and hide processes. CVE-2021-3490 demonstrated a privilege escalation via eBPF that gave full root from an unprivileged process. The LinkPro rootkit in 2024 used eBPF to hide from ps aux, netstat, ss, and even bpftool itself – it hid the eBPF programs that were doing the hiding.
From the attacker’s perspective you can imagine a scenario where you get RCE in a container. First thing you do is cat /proc/self/status | grep Seccomp. If seccomp is enabled (Seccomp: 2), you figure out what’s allowed. If bpf is allowed, you stop looking. Game over. Load an eBPF program, escalate, persist, hide.
Here’s what io_uring enables: full network I/O and file I/O without touching the syscalls normally blocked. IORING_OP_SOCKET, IORING_OP_CONNECT, IORING_OP_SEND, IORING_OP_RECV – all submitted through io_uring_enter(). If you blocked socket(), connect(), send(), recv() in your profile you start thinking that’s a good way to restrict network calls. But an attacker calls io_uring_setup(), sets up a ring, submits socket operations through io_uring_enter(), and establishes a C2 channel. No blocked syscall was ever invoked. Seccomp never fired. I’ll show you a demo in a future post.
Yeah bpf and io_uring are overtly dangerous, but they’re not alone. Check your generated profiles for add_key and keyctl – the kernel keyring family. These have been used to leak host credentials from containers. Check for kexec_load – load a new kernel. init_module and finit_module – load kernel modules. userfaultfd – historically used for kernel exploitation timing attacks.
So how bad is this? Here’s a break down of the tools I tested and how many of them include dangerous system calls across 100 images.
Why is this happening? It comes down to the tools are simple and how they trace, matters.
If we understand that a seccomp profile is applied to a PID… which PID? Containers abstract so much away it’s not clear. Then we add another layer of abstraction: Kubernetes Pods. Where does a seccomp profile get applied and how do we profile a Pod? Do we profile containers in the Pod or the entire Pod? The answer is “yes” and that’s the problem. You have 2 options for seccomp profile application:
apiVersion: v1
kind: Pod
metadata:
  name: hello-world
spec:
  securityContext:
    seccompProfile:
      type: Localhost
      localhostProfile: profiles/hello-world.json
  containers:
  - name: hello-world
    image: hello-world-cg
apiVersion: v1
kind: Pod
metadata:
  name: hello-world
spec:
  containers:
  - name: hello-world
    image: hello-world-cg
    securityContext:
      seccompProfile:
        type: Localhost
        localhostProfile: profiles/hello-world.json
As a result of this question, you get different tools capturing different system calls. My favorite example is this:
If you trace this Pod, you’re going to capture bpf() and mount() because you’re capturing the system calls of the CNI (bpf) and the init container volume mounting (mount). Now you’re doing more harm than good.
{
  "defaultAction": "SCMP_ACT_ERRNO",
  "architectures": ["SCMP_ARCH_X86_64"],
  "syscalls": [
    {
      "names": [
        "read",
        "write",
        "close",
        ...
        "bpf"
      ],
      "action": "SCMP_ACT_ALLOW"
    }
  ]
}
Woops.
Auto-generation tools have one job: record which syscalls happened, output a profile that allows them. Most of them don’t have opinions. They don’t know that bpf() is different from read(). They don’t know that io_uring_setup() can be a multiplexing bypass to seccomp. They just write down what they saw. The syscalls get into the profile through two main routes: your application actually needed them, or something else in the container lifecycle touched them and the tracer didn’t know the difference.
If your container runtime touched bpf() during startup – maybe because an eBPF-based tracer was running, maybe because containerd did something internally – it’s in the profile. If your database uses io_uring for async I/O (and MongoDB does), those syscalls are in the profile. The tool did exactly what you asked. That’s the problem.
NOTE: There are some platforms now like the Security Profiles Operator that allow you to set policies around the system calls you’ll allow.
This one surprised me and I didn’t appreciate it until recently. MongoDB and other storage engines optionally use io_uring for async I/O. It’s a legitimate performance optimization – it would submit common heavy IO operations to a ring buffer instead of directly to the kernel, the kernel processes them asynchronously, you read results without blocking. Real performance wins for heavy IO operations like databases.
If you auto-generate a seccomp profile for a MongoDB container, you’ll see io_uring_setup, io_uring_enter, and io_uring_register in the allowlist. Why?
The reason is MongoDB isn’t going to assume your threat model so it optionally attempts to use io_uring based calls to improve performance, and if it fails, it falls back to standard system calls. This means that it’s the responsibility of the system call profiler to decide which system calls should be used by the container. So as I wrote above, the tools are simple, if MongoDB tries to use io_uring then the tool needs to assume that’s what it needs.
Seccomp is simple, right? It’s just block and allow but maybe we see that to figure out what to block and allow breaks down to a few sub goals:
“Unnecessary” and “dangerous” are not the same thing. Dangerous syscalls like bpf or ptrace are direct container breakout vectors. Unnecessary syscalls — things like mkdir or link — might not be used by your app, but not an explicit attack vector.
While you can always wave the magic “defense in depth” hand to explain why you want to block arbitrary system calls, I feel very strongly that in practice, you’re doing more harm than good.
We can convince ourselves that we’ve removed an entire path of attack by not allowing an attacker to be able to use even benign system calls but the truth is we don’t really know the impact and system call inspection doesn’t provide enough context into what’s good.
So are we doing more harm than good? Let’s find out.
Next section: Bypasses and Breakouts